As consumers, we all love the convenience and flexibility of online shopping. We're all looking for the best deals, whether it is during Black Friday, Cyber Monday, or anytime during the year!
However, If you're on the marketing side, you're always looking for the best ways to understanding analytics data -- all in the hopes of significantly boosting your bottom line or your company's KPI goals.
But, just as it's imperative to prepare your store for shoppers, it's equally important to conduct a thorough analytics audit after the peak selling periods to pinpoint any areas that need to be remedied.
According to the B2B report on digital experience, 72% of respondents say the majority of their company's revenue will come from their e-commerce websites by 2025. That's huge!
Additionally, the same B2B report shows paid search as being the most effective marketing channel for organizations.
Let's take a look at the importance of accurately measuring your key data metrics so you know how well your various campaigns and channels performed.
The Importance of Well-Defined KPIs
Google Analytics lets you track more than 200 metrics, but do you know which to measure? And, more importantly, which channels are used most by your customers?
- How much of your traffic is coming from mobile vs. desktop?
- Is your store mobile-friendly? Surprisingly, some still aren't!
- Have you tested all aspects of your site's UX?
- How seamless is the buying process through checkout?
- Which channel is driving the most traffic?
Those are a few basic questions you must know the answers to - it's vital to define your key performance indicators.
In particular, you'll want to look at those that affect your bottom line and can be measured accurately.
Of course, measuring revenue is at the top of everyone's list, but where is the revenue coming from? What is the conversion rate on each marketing channel?
It's a must to measure ROI for making future changes accurately. But, let's say you want to measure a certain range, such as post-holiday metrics. What steps would you take?
Analytics Set-up is Critical
Google Analytics must be tracking correctly. While obvious, it's rarely setup to track effectively.
If your conversion tags are not gathering data, you won't be able to measure your results and implement any corresponding improvements.
Using Google Tag Manager with DataLayerimplementation is the best way to approach collecting data from your website.
With GTM running the show and pushing that data into GA, you can track everything from the performance of sales figures and exit pages to new visitor conversion rates.
At the end of the day, data-driven decisions will be the key to improving your store's future performance.
I Feel the Need...the Need for Speed

That famous quote from Maverick in Top Gun goes a long way towards all SEO and online conversion metrics.
Measuring your site speed is a great place to start by looking at what to measure.
A quick look at the statistics underscores the importance of having a website that loads immediately. And, for mobile visitors, the need for speed increases.
You can find page load times and performance data in GA by going to:
Behavior / Site Speed / Overview
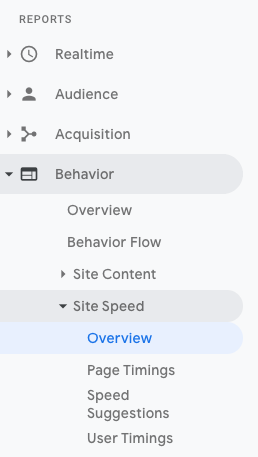
There, you will find data for page load times and server response times; the former is how long it takes your page to fully load, while the latter is also known as TTFB, or time to first byte.
Ideally, your load time should be under 2-3 seconds, and your response time needs to be less than 600ms, according to Google.
But, you want this number lower than roughly 400ms. How do you improve this number? It's most likely a bottleneck in the website's SQL database calls.
Did your website have performance issues during the holiday months? Was your site able to keep up for seasonal peak times?
Overall, negative site speed performance directly affects conversions, and this data can help you decide if your site or server might need an upgrade.
Additionally, you can use the advanced web.dev page insights from Google to find additional areas for improvement.
Hidden Analytics Data
One segment of GA that rarely gets mentioned is Lifetime Value (LTV); It can be found under the Audience / Lifetime Value menu and has extremely valuable data.
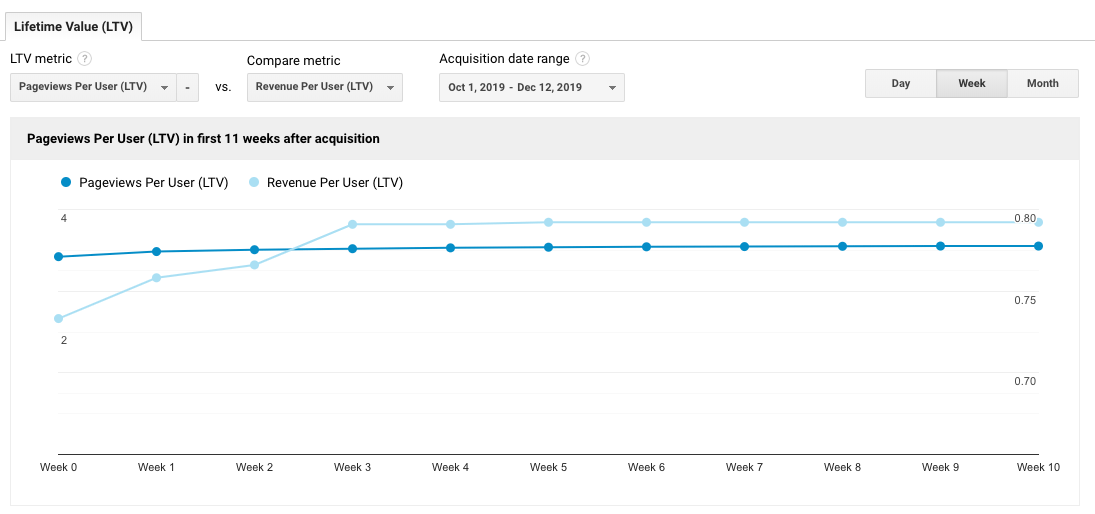
This LTV report provides a 90-day window into your data, such as revenue, sessions, and pageviews per user. You can then analyze each acquisition channel to see which campaign performed well and which needs further review.
There's an option to compare metrics. Your pageviews should be way up, and hopefully, revenue is increasing with visitor views.
Tracking Cart Progression
Another immensely valuable metric to measure is shopping cart flow and abandonment rate. This data is highly dependent on a proper tracking setup.
Data can be tracked through funnels in the Goals section or by navigation to:
Conversions / Ecommerce / Checkout Behavior
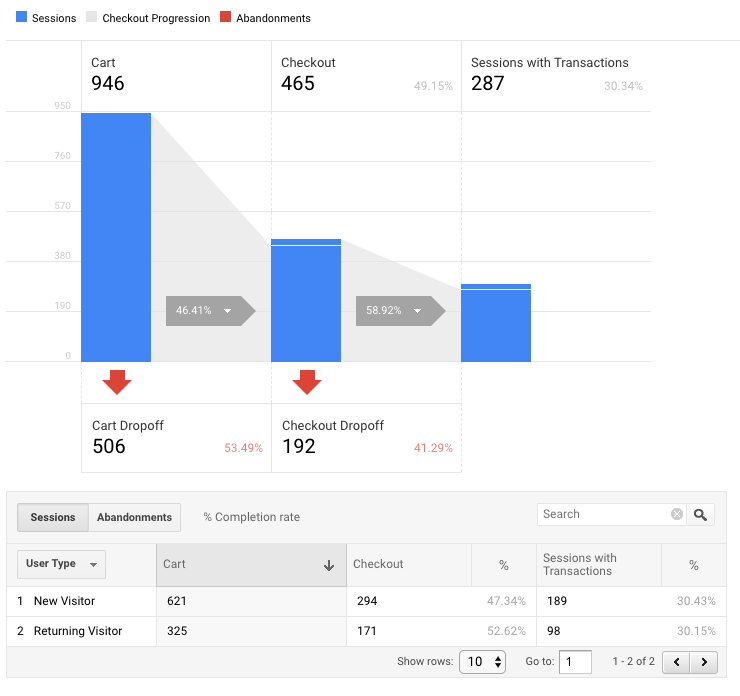
Above is a fundamental checkout behavior example. You can see New and Returning visitors and their progression through your checkout funnel.
With this advanced feature of GA, you can customize the checkout behavior to include any data you provide.
This could simply be Cart to Checkout or enhanced, through covering unique segments such as account sign-in, payment info drop-off, and so much more.
If you have a lot of drop-offs, you need to understand why. Is your website's UX clear and has a well-defined path to purchase? Is your website thoroughly tested on all browsers, including mobile?
If you don't see the "Checkout Behavior"menu, you will need to enable Ecommerce set-up in Admin / View Settings / Ecommerce Settings
I once audited a site where user sessions were cross-talking, and one user's cart had items from another user's cart additions. Not good.
Test and audit everything with your cart and checkout behaviors.
Also, there are many easy ways to optimize the checkout process, including finding leaks in your conversion funnels, simplifying the process, being transparent about shipping costs, and letting customers checkout as guests.
Besides "checkout behavior", there is analytics data on product performance, shopping behavior, and more in this section of GA.
Your e-commerce cart analytics data provides the most clues to help increase your sales and KPIs for future campaigns.
Other Marketing Considerations
Do you have a well-defined content marketing strategy? Content marketing can boost your conversion rate by almost six times, so slacking is not an option. Did you get this right during the holiday sales?
If not, it's essential to make sure you have a clear plan which defines your target customer and to be familiar with their online habits online. This will help determine the most effective types of content, whether that means blogging, making videos, using customer testimonials, or something else entirely, such as a unique web-based tool.
Do you have a newsletter? How many people signed up? This is an extremely valuable metric to track, and if your stats are disappointing, you'll want to rethink your design, visuals, layout, and even using gated content to boost sign-ups.
Luckily, there are plenty of ways to increase engagement, from offering more appealing incentives, creating a contest or giveaway, including social proof, and highlighting benefits only available to subscribers. Also, there's no shortage of inspiration out there.
Wrapping Up
In-between seasonal peak times, what should you do with all this data? What are some next steps with understanding analytics?
This information will enable you to be better prepared for the next rush of shoppers to help you double down on the best-performing channels and re-evaluate less-performing ones.
It's essential to keep the context in mind and compare to see if you're on the right track, rather than comparing, say winter sales with summer sales. Each industry has different peak sales times.
Ultimately, you can use this data to build better brand awareness, improve your marketing efforts, and optimize your funnel. Armed with the right information, you'll have the power to skyrocket your e-commerce sales.
Are your peak times mostly during the holidays? What other data measurements or KPIs do you recommend as high-priority?
Thanks for reading, and I look forward to your comments below.
